Our Location
Killa-Pardi, Dist. Valsad, 396125

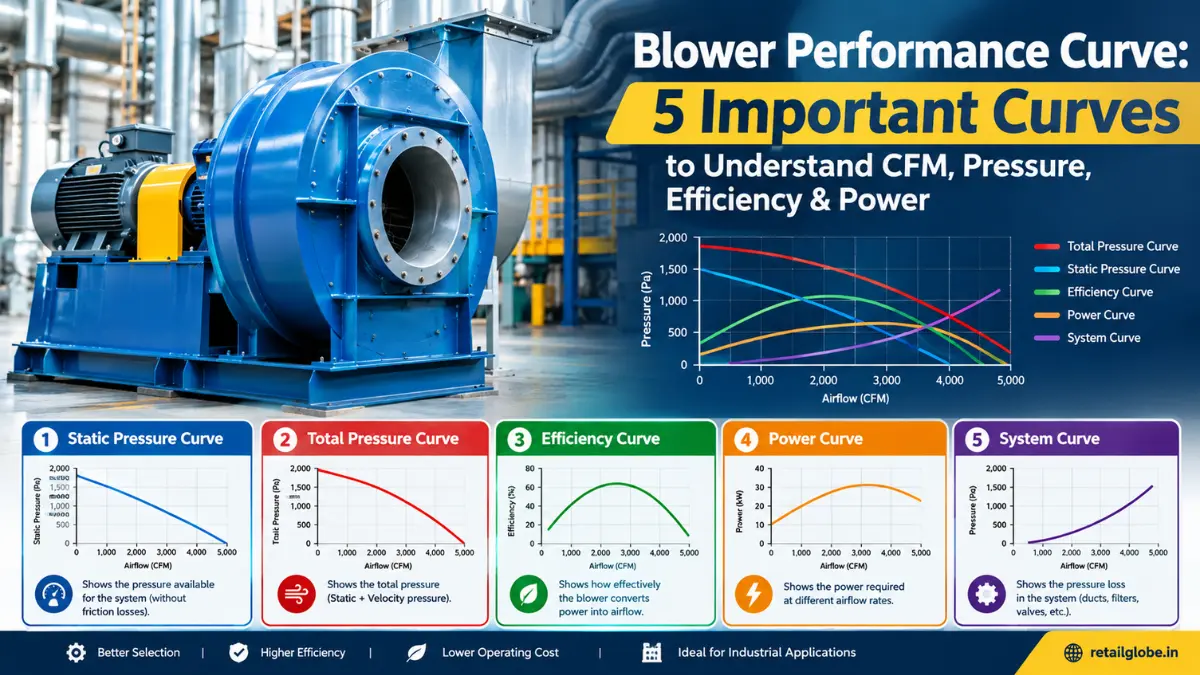
Selecting the correct industrial blower is not simply a matter of choosing the model with the highest CFM. A blower may advertise a very high airflow capacity, but that airflow can change significantly when the blower has to overcome duct resistance, filters, dampers, furnace passages, bends, or other system restrictions. This is why engineers and maintenance professionals use a blower performance curve.
A blower performance curve provides a graphical representation of how a blower performs under different operating conditions. Depending on the manufacturer’s chart, it may show airflow, static pressure, total pressure, efficiency, power consumption, speed, and operating limits.
For industrial applications in the USA and India, understanding these curves can help prevent common selection problems such as insufficient airflow, excessive motor loading, high energy consumption, unstable operation, and incorrect pressure selection.
In this guide, we will explain 5 important blower curves:
We will also explain formulas, units, practical examples, and how these curves work together to identify the actual operating point.
A blower performance curve is a graph that shows the relationship between a blower’s airflow and other performance parameters. Airflow is commonly expressed as:
Pressure may be expressed as:
Depending on the manufacturer, one chart may contain several curves.
A typical centrifugal blower performance chart may show airflow on the horizontal X-axis and pressure on the vertical Y-axis. Additional curves may indicate efficiency and power.
The most important idea is that a blower does not deliver the same pressure at every airflow rate. For example, a blower might produce high pressure at low airflow but significantly less pressure at higher airflow.
Therefore, the correct question is not: “How much maximum CFM can this blower produce?”
The better question is: “How much CFM will this blower deliver at my required system pressure?”
That distinction is extremely important during industrial blower selection.
Static pressure is the pressure available from the blower to overcome resistance in the air-moving system. In an industrial installation, resistance may come from:
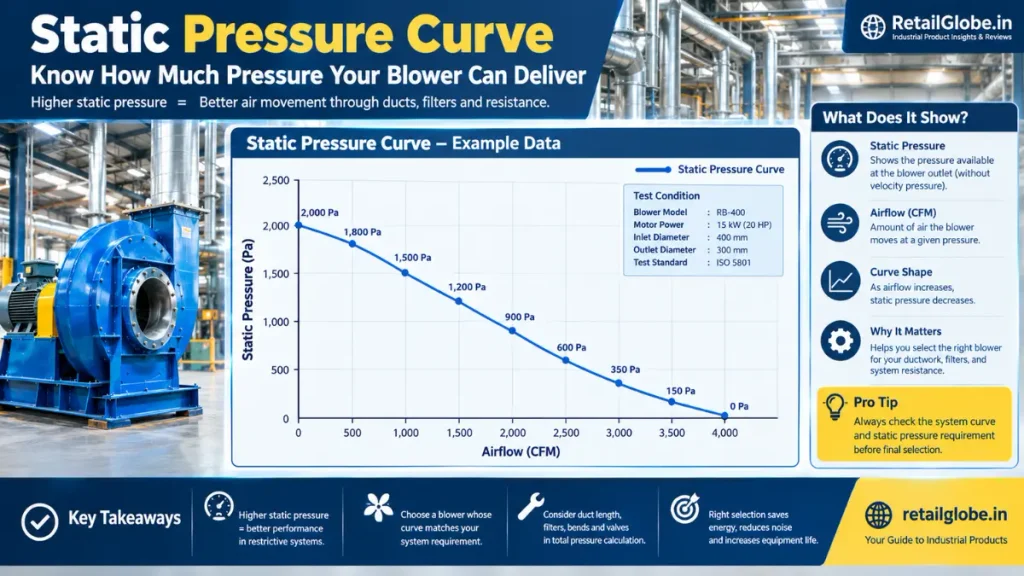
The static pressure curve shows how blower static pressure changes as airflow changes. Normally:
The exact shape depends on blower design, speed, impeller geometry, and operating conditions.
Suppose an illustrative blower has the following performance:
| Airflow | Static Pressure |
|---|---|
| 0 CFM | 1,500 Pa |
| 1,000 CFM | 1,300 Pa |
| 2,000 CFM | 950 Pa |
| 3,000 CFM | 550 Pa |
| 4,000 CFM | 150 Pa |
If your process requires 3,000 CFM at 950 Pa, this particular blower would not meet that requirement at the same operating condition. This demonstrates why maximum CFM alone is not enough.
For approximate engineering conversion: 1 inWG ≈ 249 Pa and: 1 mmWG ≈ 9.81 Pa
Therefore: 1,000 Pa ÷ 249 ≈ 4.02 inWG So 1,000 Pa is approximately 4.0 inWG.
Static pressure is particularly important for industrial systems containing significant resistance. Examples include:
What Is Total Pressure? Total pressure represents the overall pressure increase provided by the blower. A simplified relationship is:
Total Pressure = Static Pressure + Velocity Pressure
Velocity pressure represents the pressure associated with air velocity. For air-moving systems, total pressure becomes particularly useful when evaluating the complete energy change of the air.
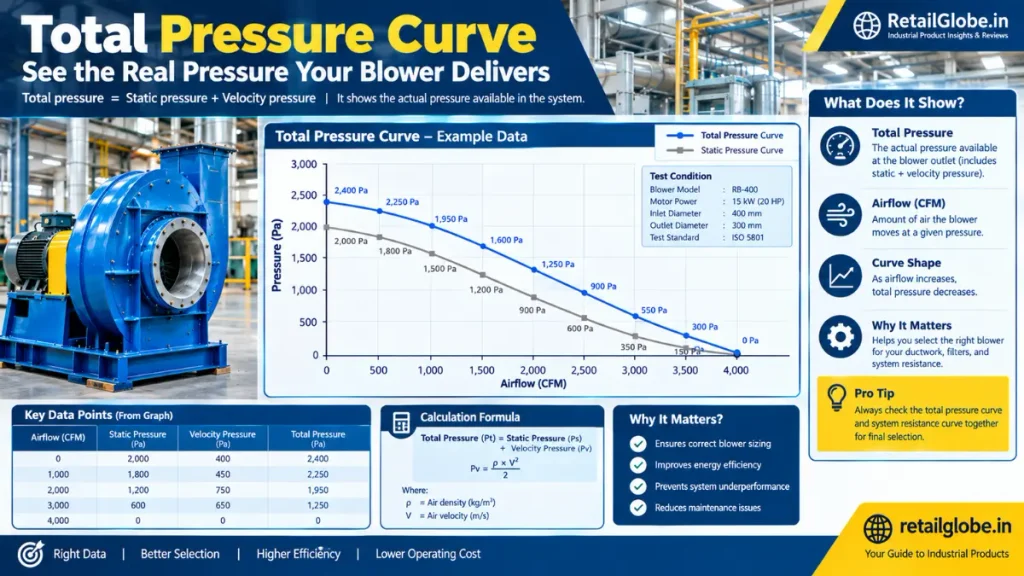
Suppose a blower produces: Static Pressure = 1,000 Pa and: Velocity Pressure = 200 Pa
Then: Total Pressure = 1,000 + 200 = 1,200 Pa
Therefore, the total pressure rise is approximately 1,200 Pa.
Engineers may use total pressure when comparing:
One of the most common mistakes is confusing static pressure and total pressure.
A manufacturer’s performance chart should always be checked to determine which pressure definition is being used. Do not compare a static-pressure requirement directly with a total-pressure curve without understanding the manufacturer’s test conditions and definitions.
The difference can be summarized simply:
| Parameter | Meaning |
|---|---|
| Static Pressure | Pressure available to overcome system resistance |
| Velocity Pressure | Pressure associated with air velocity |
| Total Pressure | Static pressure + velocity pressure |
For many practical industrial selection tasks, static pressure is highly important because the blower must overcome system resistance. However, total pressure can be essential when performing a complete engineering analysis.
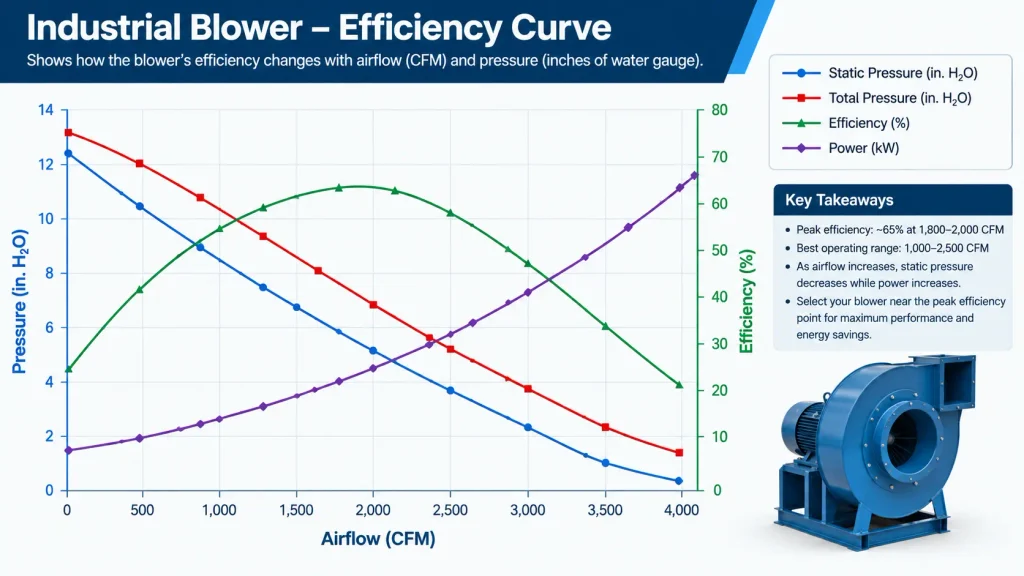
Blower efficiency tells us how effectively the blower converts input mechanical power into useful air-moving power.
where:
When using SI units:
Suppose:
Then:
If blower efficiency is 70%:
Therefore, approximately: 2.86 kW
is required at the blower shaft under this simplified condition. Actual motor selection must also consider transmission losses, motor efficiency, starting requirements, operating margin, and manufacturer recommendations.
The efficiency curve normally rises toward a maximum and then falls. The region around maximum efficiency is commonly referred to as the: Best Efficiency Point (BEP)
Operating close to the appropriate efficient region can help reduce energy consumption and unnecessary mechanical stress. However, BEP should not be treated as the only selection criterion. A blower must also meet:
An illustrative blower could have:
| Airflow | Efficiency |
|---|---|
| 1,000 CFM | 55% |
| 2,000 CFM | 68% |
| 3,000 CFM | 76% |
| 4,000 CFM | 70% |
| 5,000 CFM | 58% |
In this example, efficiency is highest around 3,000 CFM. This does not mean the blower must always operate at exactly 3,000 CFM. The actual operating point depends on the complete system.
The power curve indicates how much power the blower requires at different operating conditions. Manufacturers may express blower power as:
The power curve is important for selecting the motor and estimating operating energy requirements.
A simplified relationship is: Power = Air Power ÷ Efficiency
For SI units: Power (W) = Q × ΔP ÷ η
where:
For example:
Therefore: Power = 2 × 1,000 ÷ 0.70 ≈ 2,857 W = 2.86 kW
This is a simplified theoretical calculation.
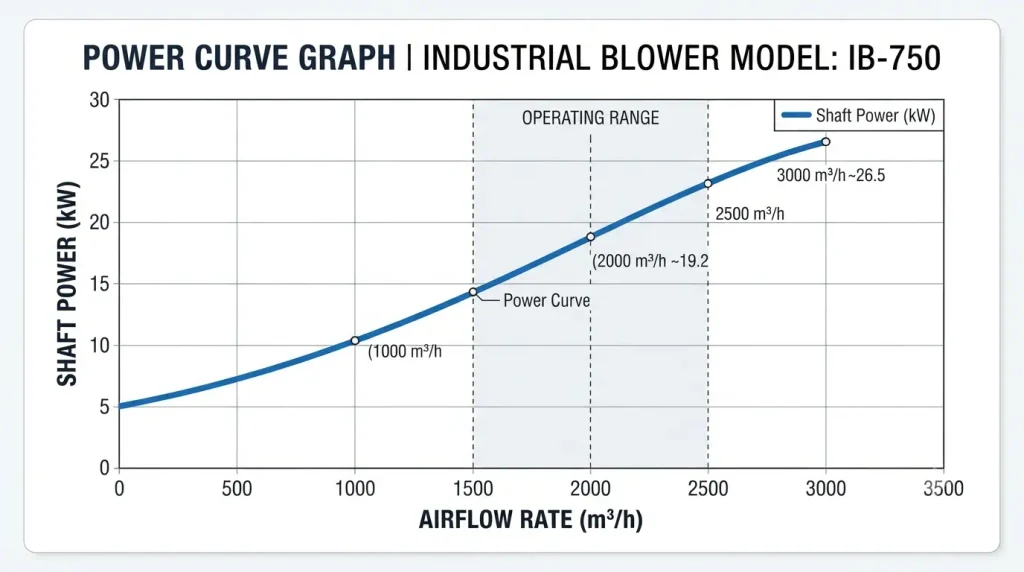
Suppose the blower’s calculated shaft requirement is approximately 7 kW. The engineer must not simply assume that any nearby motor rating is acceptable. Motor selection should consider:
For example, industrial installations in the USA may commonly use 60 Hz electrical systems, while India commonly uses 50 Hz systems. The blower’s rated speed and performance must therefore be checked against the actual electrical supply.
The system curve is one of the most important concepts in blower selection. Unlike the blower performance curve, the system curve describes the resistance of the connected air system. The system may include:
As airflow increases, system resistance normally increases rapidly.
For many systems: ΔP ∝ Q²
A simplified equation is: ΔP = KQ²
where:
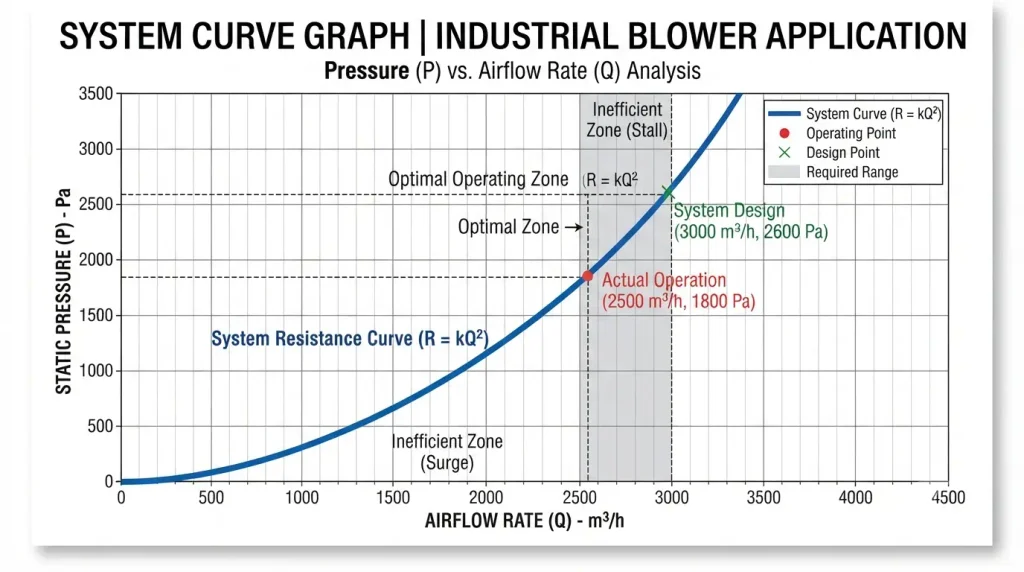
Use: ΔP₂ = ΔP₁ × (Q₂/Q₁)²
Therefore:
Therefore, doubling airflow can increase system pressure requirement by approximately four times under this simplified relationship. This is why increasing blower airflow is not always as simple as increasing motor size.
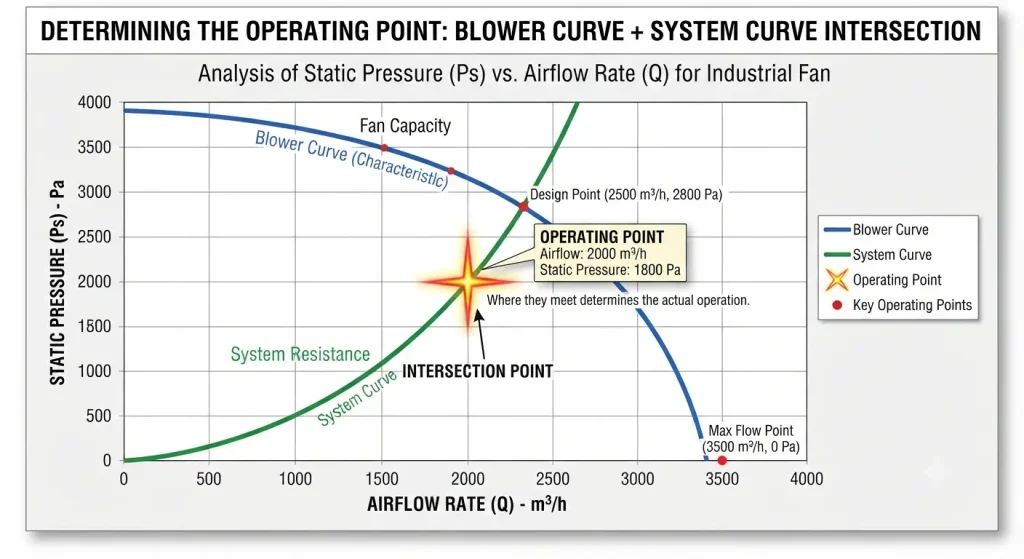
This is arguably the most important concept in understanding blower performance curves. The blower has its own performance characteristics. The system has its own resistance characteristics. The operating point occurs where the blower performance curve intersects the system curve.
At that point: Blower pressure = System pressure and the corresponding airflow is the actual operating airflow.
For example:
Required system: 3,000 CFM at 1,000 Pa
Several factors can change actual blower performance.
Consider a factory using a centrifugal blower to provide combustion air to a furnace. Suppose the design requirement is:
Engineer should look for a blower whose performance curve can deliver: 5,000 CFM at 2,000 Pa
The engineer should then check:
A blower capable of 8,000 CFM at nearly zero pressure does not automatically satisfy this application.
The blower may deliver less than 4,000 CFM unless the blower/system has sufficient operating capability. This illustrates why maintenance of filters and ducts can directly affect blower performance.
The engineer should identify the intersection of the blower curve and system curve around the required operating point. The efficiency and power curves should then be checked. If the blower operates far away from its efficient region, the system may consume more electrical energy than expected.
When reading a manufacturer’s chart, look for these parameters.
| Airflow | CFM or m³/h | This tells you how much air the blower can move. |
| Pressure | Pa, kPa, mmWG, inWG | This tells you how much resistance the blower can overcome. |
| Speed | RPM | Changing speed can significantly change blower performance. |
| Efficiency | % | Higher efficiency generally means less input power is required for the same useful air power. |
| Power | kW or HP | This helps with motor selection. |
| Operating Temperature | Temperature affects air density and therefore blower performance. | |
| Air Density | Performance can change when handling: Hot air Cold air High-altitude air Process gases |
1. Air Power : P_air = Q × ΔP
2. Efficiency : η = P_air / P_shaft × 100
3. Shaft Power : P_shaft = Q × ΔP / η
4. System Pressure : ΔP = KQ²
5. System Pressure Change : ΔP₂ = ΔP₁ × (Q₂/Q₁)²
For readers working between US and SI units: 1 CFM ≈ 0.0004719 m³/s
Therefore: 5,000 CFM × 0.0004719 ≈ 2.36 m³/s
This conversion can be useful when applying the air-power equation.
Step 1: Determine Required Airflow
Step 2: Determine System Pressure
Suppose the result is: 2,000 Pa
Step 3: Find the Required Operating Point
Step 4: Check the Static Pressure Curve
Step 5: Check Total Pressure
Step 6: Check Efficiency
Step 7: Check Power
Step 8: Select the Motor
Step 9: Check Temperature and Density
Step 10: Confirm Operating Range
Mistake 1: Selecting by Maximum CFM
Mistake 2: Ignoring System Resistance
Mistake 3: Confusing Static and Total Pressure
Mistake 4: Ignoring Efficiency
Mistake 5: Selecting Motor Size Without Checking the Power Curve
Mistake 6: Ignoring Air Temperature
Mistake 7: Ignoring Filter Loading
| Curve | Main Purpose | Typical Unit |
|---|---|---|
| Static Pressure Curve | Shows pressure available against airflow | Pa, mmWG, inWG |
| Total Pressure Curve | Shows overall pressure rise | Pa, kPa |
| Efficiency Curve | Shows blower efficiency | % |
| Power Curve | Shows required power | kW, HP, BHP |
| System Curve | Shows system resistance | Pa, mmWG, inWG |
Industrial blower selection principles are broadly similar in both markets, but actual installations can have different electrical, environmental, and regulatory conditions.
In the USA, engineers may encounter systems designed around 60 Hz electrical power, while India commonly uses 50 Hz power. Motor speed and blower performance must therefore be checked against the actual motor and drive configuration. Industrial conditions can also vary significantly.
For example:
These conditions may require a blower designed specifically for the application rather than a standard catalog model. Always use the manufacturer’s performance data for final equipment selection.
For geometrically similar fans/blowers, commonly used affinity-law relationships are:
where:
For example, if speed increases by 10%:
These relationships are simplified engineering relationships and should not replace manufacturer data, particularly where density, VFD limits, compressibility, temperature, or operating constraints are significant.
This demonstrates why increasing blower speed can have a substantial impact on power consumption.
A practical selection method is:
Required Process Airflow → System Pressure Calculation → Blower Performance Curve → Operating Point → Efficiency → Power → Motor
This sequence prevents a common problem where someone selects a blower based only on CFM. For example:
Then evaluate: Static pressure → Total pressure → Efficiency → Power → System curve
The final selection should satisfy the process requirement while remaining within the manufacturer’s recommended operating range.
Understanding a blower performance curve is essential for selecting the right industrial blower for ventilation, furnace combustion, dust collection, drying, cooling, exhaust, and process-air applications.
The five curves provide different but connected pieces of information:
Therefore, don’t select an industrial blower simply because it has a high advertised CFM. Determine the required CFM + pressure, calculate the system resistance, locate the operating point, check efficiency and power, and then verify the motor, temperature, speed, and manufacturer’s operating limits.
For engineers, maintenance professionals, technicians, and industrial buyers in the USA and India, learning to read these five curves can make blower selection more accurate and help avoid problems such as insufficient airflow, excessive energy consumption, motor overload, and poor process performance.
In simple terms:
The right blower is not the one with the highest CFM—it is the one that delivers the required airflow at the required pressure within a suitable operating and efficiency range.
A blower performance curve is a graph showing how a blower’s airflow relates to pressure, efficiency, power, and sometimes other operating parameters.
The five important curves discussed in this guide are:
Static pressure curve
Total pressure curve
Efficiency curve
Power curve
System curve
No single curve should be considered independently. The required airflow and system pressure establish the operating point, while efficiency and power help evaluate the blower and motor requirements.
Static pressure represents pressure available to overcome system resistance, while total pressure includes static pressure plus velocity pressure.
A system curve represents the pressure required by the connected duct and process system at different airflow rates.
In many air-moving systems, pressure loss approximately follows the square of airflow:
ΔP ∝ Q²
Therefore, increasing airflow can significantly increase system resistance.
The operating point is the intersection between the blower performance curve and the system curve. It represents the approximate airflow and pressure at which the blower/system combination actually operates.
Blower efficiency indicates how effectively input power is converted into useful air-moving power.
A simplified SI calculation is:
P = Q × ΔP ÷ η
where Q is m³/s, ΔP is Pa, and η is efficiency as a decimal.
No. A blower should generally be selected based on the required airflow at the required pressure, followed by checks of efficiency, power, temperature, speed, and operating range.
A dirty filter increases system resistance. This changes the system curve and can move the operating point toward lower airflow.
Usually, the manufacturer supplies the blower performance data. The system curve is normally determined from the resistance characteristics of the customer’s actual installation.
Yes. Changing blower speed changes airflow and pressure characteristics. However, the permissible speed range and motor/blower limitations must be checked against manufacturer specifications.

Welcome! I am a dedicated entrepreneur running an industrial affiliate product website, helping businesses and professionals find the best tools, equipment, and resources for their needs. With a passion for industrial products and a keen eye for quality, I curate and recommend top-performing items that enhance efficiency and reliability.
Through my platform, I aim to simplify the buying process by providing valuable insights, expert reviews, and trusted affiliate links to high-quality industrial products. Whether you’re looking for the latest machinery, tools, or safety gear, I strive to connect you with the best solutions available.
Thank you for visiting, and I look forward to helping you make informed purchasing decisions!
